- Home
- Technical Analysis
Day Trading Strategies

Edited By
Dan Buckley
Updated
Sep 13, 2024
Technical analysis involves studying past market data to predict future price movements. This approach is a key method within security analysis, alongside fundamental analysis.
Quick Introduction
- Technical analysis is an approach to finding trading opportunities by assessing price patterns on charts.
- Traders believe studying historical market activity and price fluctuations can help identify future trends.
- It can be applied to a range of strategies strategies and markets including day trading forex, crypto, oil and other commodities.
- Technical analysis is suitable for all experience levels from beginners to professionals.
Best Brokers for Technical Trading
For advanced charting features, which make technical analysis easier to apply, we recommend the trading platform TradingView or broker eToro.
Technical Analysis Explained
Technical analysis encompasses various charts, indicators, and tools that help investors identify future trading opportunities by analyzing historical market behavior and price movements.
In contrast, fundamental analysis can be applied at both the microeconomic and macroeconomic levels. On the micro level, it involves examining factors such as revenues, costs, earnings, assets and liabilities, capital structure, and “soft” elements like management quality and competitive positioning.
Macro-level fundamental analysis involves studying and forecasting economic growth, inflation, credit cycles, interest rate trends, and capital flows between countries. It also examines labor and resource utilization, demographic trends, central bank and government policies, geopolitical issues, consumer and business trends, as well as “soft” data like sentiment or confidence surveys.
Most large banks and brokerages today have dedicated teams specializing in both fundamental and technical analysis. Generally, the more high-quality information a trader uses to improve the chances of making accurate predictions, the better their trading outcomes are likely to be.

Assumptions in Technical Analysis
- Price history tends to be cyclical and
- Prices, volume, and volatility tend to run in distinct trends
Market Cyclicality
Price, Volume, and Volatility Run in Distinct Trends

Characteristics
Analytical Approaches

Types of Charts
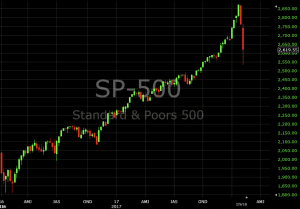
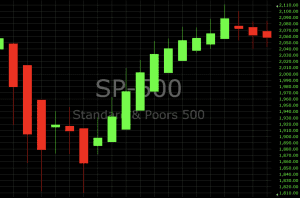
Candlestick

Open-High Low-Close

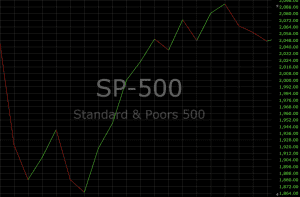
Line

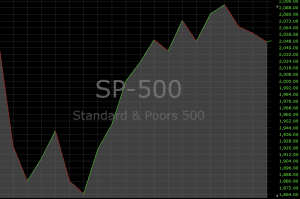
Area

Heiken-Ashi
- Open = (Open of previous bar + Close of previous bar) / 2
- Close = (Open + High + Low + Close) / 4
- High = Highest of High, Open, or Close
- Low = Lowest of Low, Open, or Close


